Tools of the Trade: VS Code Debug

Front-end Development
Back-end Development

The VS Code has several third party extensions that take the base text editor to a whole new level. PHP Debug is one that we use regularly in conjunction with Xdebug Chrome Extension to allow us to view the state of our code during runtime. This can be an excellent tool to discover what the code is actually doing compared to what we think it should do.

Listen for XDebug

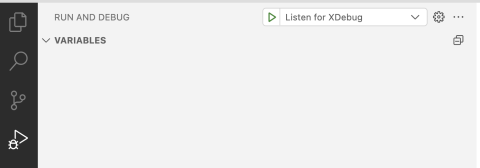
To start debug mode from VS Code you start with opening the Run and Debug pane using the sidebar menu. From there you can click the play icon button at the top of that window to start debugging. If the project is set up correctly, all you will have to do is to use the Xdebug Chrome Extension to enable Debug.

VS Code side bar run and debug expanded

Breakpoints

Breakpoints are used to tell the debugger to stop processing code at the line where you put the breakpoint and wait until you resume operations or take manual control of code progression. Adding a basic breakpoint is as simple as left clicking just left of the line number you want the code to pause at.

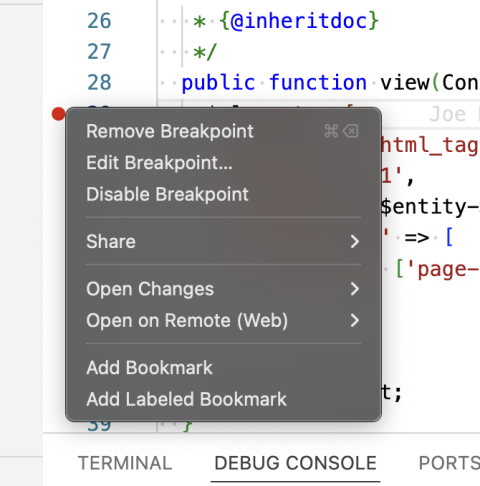
Breakpoint right-click options

For code that gets triggered repeatedly, such as within a loop or a general display function, you can add logic to when the breakpoint actually stops the code. This can be done by right clicking the breakpoint to open its menu options, click “Edit Breakpoint…”, and then either add an expression that when true you would like to take manual control over the code progression or one of the other options.

Navigation

When your code does reach a breakpoint, it will drop into manual progression mode where you will use the debug navigation form to control how you should progress.

PHP Debug action menu

“Continue” will resume regular code progression until it hits another breakpoint or it completes the request. When you complete your review of the code you typically hit this to allow all of the other code to progress as normal, so you can see the results in the browser.

“Step Over” allows you to progress through the code stopping at the next line. This will not drill into functions but allow those functions to run normally until the results are returned to the calling scope. When you reach the end of a scope this will progress up the stack trace similar to Step Out noted below.

“Step Into” will step into each function call on the current line. This is especially useful when your code calls other functions and you are getting back unexpected results. You can drill down to each function to identify what is happening within those scopes.

“Step Out” allows the current scope’s code to finish and you will take back over manual progression when the function returns to the calling function. If you have used a Step Into but realize that the function is not what you need to be looking at you can use Step Out to return to the previous scope.

“Stop” this will stop debugging mode entirely. This means that on your next request you will allow code to resume as normal, ignoring any breakpoints. You will want to do this whenever you are done with your testing as debugging can cause your pages and other content to load much slower than normal.

Debug Console

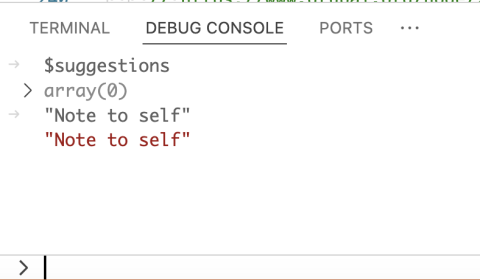
When debugging and in manual processing mode, the Debug Console can be used to execute custom code and will print the results to the Debug Console window. This is useful to quickly identify variable values or changing values on the fly. The Debug Console log will remain until you restart debugging, so it can be used as a way to record differences between divergent runs.

Example debug console messages

Panes

Beyond starting debugging, the run and debug window has several information panes that get populated with data when you are manually processing.

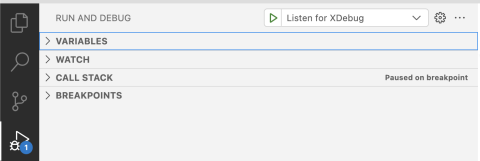
VS Code debug window with panes collapsed

The “Variables” pane will show you all of the variables that are available to the scope of the line of code the debugger is waiting to run. It also includes the variable structure if it is an object or array along with its values. This can be used to quickly check the value of any of these variables. There is a limit of how deep you can go within an object, which may require you to use the Debug Console mentioned above or the Watch pane detailed below to determine the value of a variable.

The “Watch” pane allows you to add custom expressions to its list. These expressions can be used to display the value of any variable but does not allow you to edit anything. These expressions will also be updated automatically as the code runs and the variable may change. If the variable does not exist within the scope or has not been declared yet, then the note that it “can not get [the] property”. I typically use this area for checking values instead of the Debug Console, so that I do not have to retype the expression over again and can quickly check the value as things change.

The “Call Stack” pane shows the full list of functions that are waiting on the current line to execute. If you use Step Out, you would move up to the next scope in this list until it eventually was empty. This can be used to locate other functions where you may want to add breakpoints for further testing.

The “Breakpoints” pane lists all breakpoints you have set within your project. It also includes more generic breakpoint types that can be selected. If these generic breakpoints are enabled, then anywhere in your code that one of those things is triggered the debugger will stop at and allow you to manually control progression.

Need a fresh perspective on a tough project?

Let’s talk about how RDG can help.

Contact Us