Tools of the Trade: Chrome Developer Tools

Front-end Development
Back-end Development

Google Chrome’s browser Developer Tools (DevTools) is a collection of built-in features that allows you to view the raw data of your website at load time. It can be used to review the underlying html code, troubleshoot javascript errors, and even see which resources are not loading as desired.

Opening Developer Tools

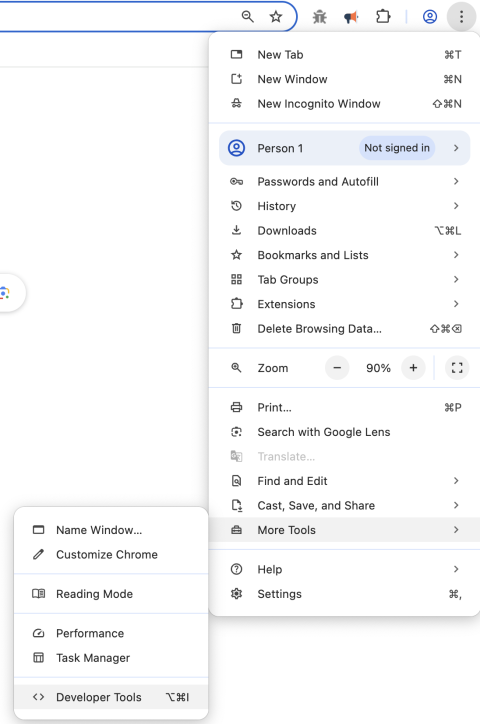
The easiest way to open DevTools is by simply right clicking anywhere within your webpage and then selecting “Inspect”. This will open a separate interface within your tab that can be used to interact with the DevTools features. You may move this interface but I tend to keep it pinned to the right side of my browser window. If the webpage has alternative right-click options, you may also open DevTools through Chrome’s menu under “More Tools” > “Developer Tools” or “View” > “Developer” > “Developer Tools”.

Chrome menu open with “More tools” expanded and “Developer tools” highlighted.

Elements Tab

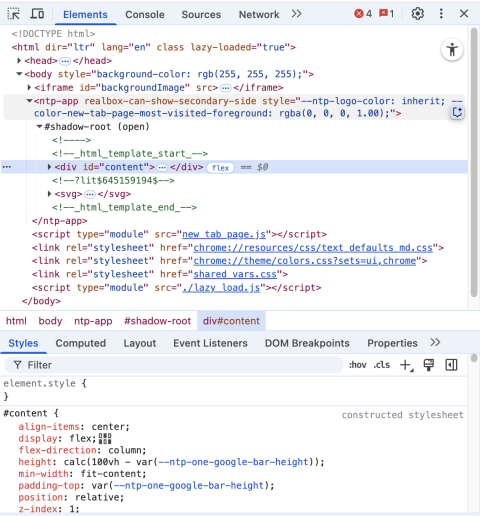
Elements tab showing HTML structure

The Elements tab within DevTools shows the majority of the page’s html. It may show all of the html but I have often seen it truncate large continuous text for display. This includes embedded javascript and style elements as well as long text based content. Beyond these situations, the elements tab will allow you to look at the nuts and bolts of your website.

If something is not displaying as you intended and need to locate where that specific element is being generated, you can often use the id or class fields of the element in your code searches. Additionally, when looking at inputs you can often identify the machine name or value, which may also be used to narrow down your search.

Another thing to look for in the elements is any comments included in the html. Drupal theme files will often include details about which template file they used to display elements and suggestions for naming conventions for files to override the template used.

Lastly, you may also use the elements tab to make temporary changes to your page. This can be used for quickly comparing or testing changes in element styling or spacing before implementing those changes into the site’s code. It may also be used to change restrictions on form inputs, which could result in submission of incomplete or even malicious values.

Console Tab

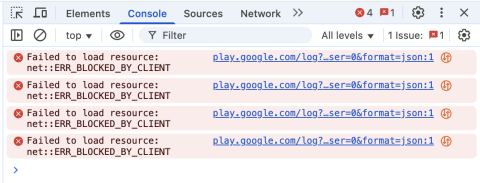
Console tab displaying log messages

The Console tab within DevTools shows any and all errors and messages that get logged to the browser’s console. This typically includes pages or resources that do not load and javascript errors. If you are trying to troubleshoot a javascript error, you may add debugging lines, which will send messages to the console log such as `console.log(“message”);`.

If you had DevTools open when you loaded the page, most javascript errors will have a link that will take you to the javascript file that caused the error within the Sources tab. Similarly, 500 error responses will include a link to the specific request in the Network tab.

Sources Tab

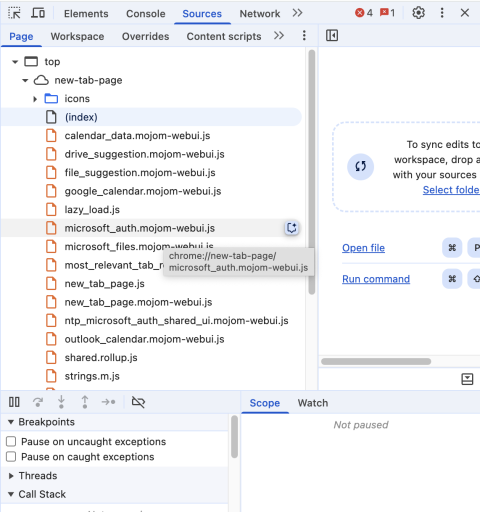
Sources tab showing website files and code

The Sources tab within DevTools shows you an organized list of all of the files downloaded by the browser at the request of the page you are viewing. These files are organized by the domain they are being pulled from. You can also view the individual files here and using the link from a console error caused by js code in one of these files will jump you to the specific file in this tab.

Network Tab

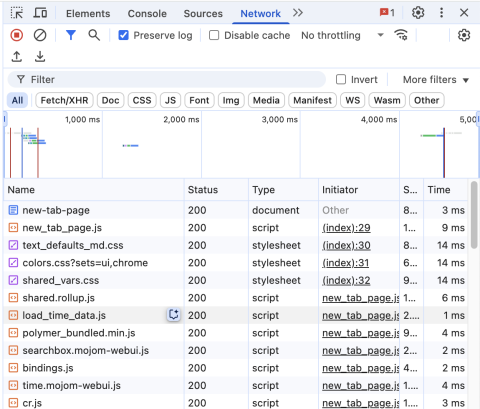
Network tab showing a list of loaded resources

The Network tab within DevTools allows you to see a full list of every request your browser made in the process of loading the page while the DevTools is open. This includes the initial page load along with any resources that were requested in the page’s header such as javascript files (.js) and style sheets (.css). It also includes any media that needs to be loaded onto the page such as image files, video files, or even font files.

I find that the most useful columns in the network file list are the status and time columns. The status helps you identify which files had issues loading. If DevTools identifies the status code as a failure it will also change the row’s text color to red for quicker identification. The typical response codes include 200 OK - the file was returned successfully, 404 Not Found - the file could not be found, and 500 Internal Server Error - the server encountered an error when trying to resolve the request.

As for the time column, if a request has not been completed but the browser is still expecting a result, this column will read “pending”. For longer running requests such as building reports, this allows you to confirm that the request is still active compared to having a 500 status mentioned above. The browser will only wait so long for a response from the server, so if you get a 504 status message it means that the server either failed without returning a response or you need to take steps to mitigate the long running process.

You can also click into each request opening another pane that allows you to look at the request headers and parameters as well as the response. If there is a server error and the server is set up to return error messages such as how our local environments are configured, the response will often include the error message as well as where that error occurred and its stack trace to help you locate the code that needs fixing.

Need a fresh perspective on a tough project?

Let’s talk about how RDG can help.

Contact Us